Exploit Development Windows User Mode WinDbg
WinDbg
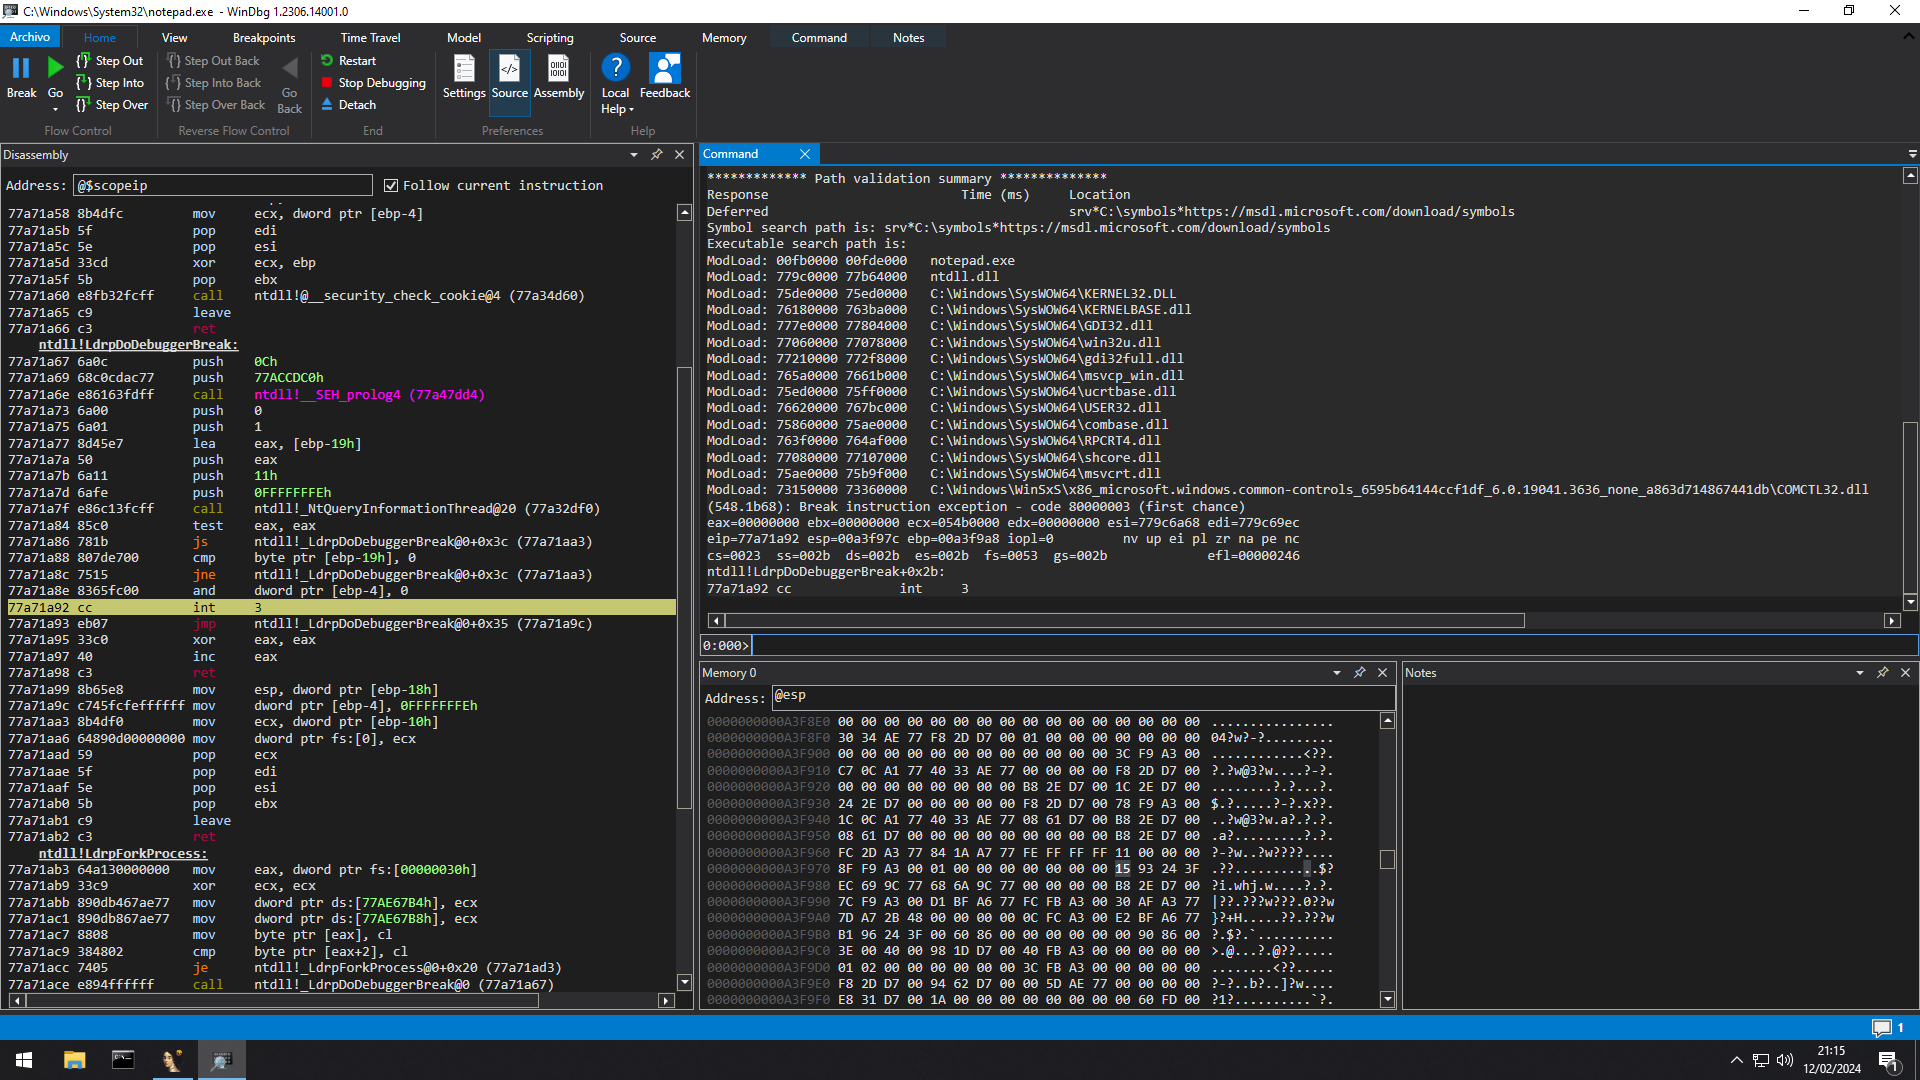
Although there are many debuggers today, such as Immunity Debugger or x32dbg, one thing that WinDbg offers, unlike these, is support for x64 architecture. Additionally, it can debug programs in both “user-mode” and “kernel-mode.” Moreover, it is a debugger developed by Microsoft. What sets it apart from other debuggers is that it uses commands.
Basics
Before starting with commands to analyze memory, we can learn the basic commands. The g command simply runs the program.
1
2

0:000> g
With the .restart command, we can restart the application we’re debugging.
1
2
3
4
5
6
7
8

0:000> .restart
(1c48.229c): Break instruction exception - code 80000003 (first chance)
eax=00000000 ebx=00000000 ecx=68130000 edx=00000000 esi=77276a68 edi=772769ec
eip=77321a92 esp=02ddf51c ebp=02ddf548 iopl=0         nv up ei pl zr na pe nc
cs=0023  ss=002b  ds=002b  es=002b  fs=0053  gs=002b             efl=00000246
ntdll!LdrpDoDebuggerBreak+0x2b:
77321a92 cc              int     3
The qd command allows us to quit and detach, stopping the debugging of the process.
1
2

windbg> qd
Assemble
Using the a command, we can input asm instructions at a specific address. Once we finish writing the instructions, we end with an enter.
1
2
3
4
5
6
7
8

0:000> a esp
003df888 push esi
003df889 pop eax
003df88a mov esi,edi
003df88c push eax
003df88d ret
003df88e
With the u command, we can view the asm instructions at a specific address, such as the stack we just modified.
1
2
3
4
5
6
7

0:000> u esp
003df888 56              push    esi
003df889 58              pop     eax
003df88a 8bf7            mov     esi,edi
003df88c 50              push    eax
003df88d c3              ret
Display
To display the bytes at a specific address, we can use db to see each byte and its ASCII representation if available.
1
2
3
4
5
6
7
8
9
10

0:000> db esp
0043f464  2b 0e a2 36 ec 69 9c 77-68 6a 9c 77 00 00 00 00  +..6.i.whj.w....
0043f474  b8 2e 48 00 64 f4 43 00-d1 bf a6 77 e4 f6 43 00  ..H.d.C....w..C.
0043f484  30 af a3 77 7b 37 4d 41-00 00 00 00 f4 f6 43 00  0..w{7MA......C.
0043f494  e2 bf a6 77 4f 0c a2 36-00 b0 38 00 00 00 00 00  ...wO..6..8.....
0043f4a4  00 e0 38 00 3e 00 40 00-98 1d 48 00 28 f6 43 00  ..8.>.@...H.(.C.
0043f4b4  00 00 00 00 01 02 00 00-00 00 00 00 24 f6 43 00  ............$.C.
0043f4c4  00 00 00 00 f8 2d 48 00-94 62 48 00 00 5d ae 77  .....-H..bH..].w
0043f4d4  00 00 00 00 e8 31 48 00-1a 00 00 00 00 00 00 00  .....1H..........
Similarly, we can show bytes in words, dwords, or qwords using dw, dd, and dq respectively. This is quite useful for representing addresses.
1
2
3
4
5
6
7
8
9
10

0:000> dw esp
0043f464  0e2b 36a2 69ec 779c 6a68 779c 0000 0000
0043f474  2eb8 0048 f464 0043 bfd1 77a6 f6e4 0043
0043f484  af30 77a3 377b 414d 0000 0000 f6f4 0043
0043f494  bfe2 77a6 0c4f 36a2 b000 0038 0000 0000
0043f4a4  e000 0038 003e 0040 1d98 0048 f628 0043
0043f4b4  0000 0000 0201 0000 0000 0000 f624 0043
0043f4c4  0000 0000 2df8 0048 6294 0048 5d00 77ae
0043f4d4  0000 0000 31e8 0048 001a 0000 0000 0000
1
2
3
4
5
6
7
8
9
10

0:000> dd esp
0043f464  36a20e2b 779c69ec 779c6a68 00000000
0043f474  00482eb8 0043f464 77a6bfd1 0043f6e4
0043f484  77a3af30 414d377b 00000000 0043f6f4
0043f494  77a6bfe2 36a20c4f 0038b000 00000000
0043f4a4  0038e000 0040003e 00481d98 0043f628
0043f4b4  00000000 00000201 00000000 0043f624
0043f4c4  00000000 00482df8 00486294 77ae5d00
0043f4d4  00000000 004831e8 0000001a 00000000
1
2
3
4
5
6
7
8
9
10

0:000> dq esp
0043f464  779c69ec`36a20e2b 00000000`779c6a68
0043f474  0043f464`00482eb8 0043f6e4`77a6bfd1
0043f484  414d377b`77a3af30 0043f6f4`00000000
0043f494  36a20c4f`77a6bfe2 00000000`0038b000
0043f4a4  0040003e`0038e000 0043f628`00481d98
0043f4b4  00000201`00000000 0043f624`00000000
0043f4c4  00482df8`00000000 77ae5d00`00486294
0043f4d4  004831e8`00000000 00000000`0000001a
By default, dd shows 32 dwords, but we can control this using L.
1
2
3

0:000> dd esp L4
0043f464  36a20e2b 779c69ec 779c6a68 00000000
When a pointer is found at the address where dd is performed, such as esp + 4 in this case, we can use poi() to see the dwords of that pointer.
1
2
3

0:000> dd poi(esp + 4) L4
779c69ec  6b6e696d 656e7265 746e5c6c 5c6c6c64
Interestingly, while db shows ASCII representation to the right, dw and dd do not. To view ASCII representation, we can use dW and dc respectively.
1
2
3
4
5
6
7
8
9
10
11
12
13
14
15
16
17
18
19
20
21
22
23
24
25
26
27
28
29
30
0:000> db kernel32
75de0000  4d 5a 90 00 03 00 00 00-04 00 00 00 ff ff 00 00  MZ..............
75de0010  b8 00 00 00 00 00 00 00-40 00 00 00 00 00 00 00  ........@.......
75de0020  00 00 00 00 00 00 00 00-00 00 00 00 00 00 00 00  ................
75de0030  00 00 00 00 00 00 00 00-00 00 00 00 e8 00 00 00  ................
75de0040  0e 1f ba 0e 00 b4 09 cd-21 b8 01 4c cd 21 54 68  ........!..L.!Th
75de0050  69 73 20 70 72 6f 67 72-61 6d 20 63 61 6e 6e 6f  is program canno
75de0060  74 20 62 65 20 72 75 6e-20 69 6e 20 44 4f 53 20  t be run in DOS
75de0070  6d 6f 64 65 2e 0d 0d 0a-24 00 00 00 00 00 00 00  mode....$.......

0:000> dW kernel32
75de0000  5a4d 0090 0003 0000 0004 0000 ffff 0000  MZ..............
75de0010  00b8 0000 0000 0000 0040 0000 0000 0000  ........@.......
75de0020  0000 0000 0000 0000 0000 0000 0000 0000  ................
75de0030  0000 0000 0000 0000 0000 0000 00e8 0000  ................
75de0040  1f0e 0eba b400 cd09 b821 4c01 21cd 6854  ........!..L.!Th
75de0050  7369 7020 6f72 7267 6d61 6320 6e61 6f6e  is program canno
75de0060  2074 6562 7220 6e75 6920 206e 4f44 2053  t be run in DOS
75de0070  6f6d 6564 0d2e 0a0d 0024 0000 0000 0000  mode....$.......

0:000> dc kernel32
75de0000  00905a4d 00000003 00000004 0000ffff  MZ..............
75de0010  000000b8 00000000 00000040 00000000  ........@.......
75de0020  00000000 00000000 00000000 00000000  ................
75de0030  00000000 00000000 00000000 000000e8  ................
75de0040  0eba1f0e cd09b400 4c01b821 685421cd  ........!..L.!Th
75de0050  70207369 72676f72 63206d61 6f6e6e61  is program canno
75de0060  65622074 6e757220 206e6920 20534f44  t be run in DOS
75de0070  65646f6d 0a0d0d2e 00000024 00000000  mode....$.......
If we only want to see the ASCII representation and not the bytes, we can use da.
1
2
0:000> da kernel32
75de0000  "MZ."
An advantage of WinDbg is its ability to represent specific structures by displaying their values according to that structure. For example, in the exception handler, it makes it more readable by showing the addresses of the handler and the next SEH (Structured Exception Handling) record.
1
2
3
4
5
typedef struct _EXCEPTION_REGISTRATION_RECORD
{
     PEXCEPTION_REGISTRATION_RECORD Next;
     PEXCEPTION_DISPOSITION Handler;
}
1
2
3
0:000> dt ntdll!_EXCEPTION_REGISTRATION_RECORD
   +0x000 Next             : Ptr32 _EXCEPTION_REGISTRATION_RECORD
   +0x004 Handler          : Ptr32     _EXCEPTION_DISPOSITION
We can provide it with the address of the ExceptionList or the address where the structure is located so that it shows the addresses of its values, such as Handler or Next.
1
2
3
4
5
6
7
8
9
10
11
12
13
14
15
16
17
18
19
20
21
22
23
0:000> !teb
TEB at 02b5b000
    ExceptionList:        0056f280
    StackBase:            00570000
    StackLimit:           0055f000
    SubSystemTib:         00000000
    FiberData:            00001e00
    ArbitraryUserPointer: 00000000
    Self:                 02b5b000
    EnvironmentPointer:   00000000
    ClientId:             00001534 . 0000161c
    RpcHandle:            00000000
    Tls Storage:          02d13180
    PEB Address:          02b58000
    LastErrorValue:       0
    LastStatusValue:      0
    Count Owned Locks:    0
    HardErrorMode:        0

0:000> dt ntdll!_EXCEPTION_REGISTRATION_RECORD 0056f280
   +0x000 Next             : 0x0056f4e4 _EXCEPTION_REGISTRATION_RECORD
   +0x004 Handler          : 0x772eaf30     _EXCEPTION_DISPOSITION  ntdll!_except_handler4+0
You can also specify a particular field, such as Handler or Next in this case, so that it only displays the information for that value and not the others.
1
2
0:000> dt ntdll!_EXCEPTION_REGISTRATION_RECORD 0056f280 Handler
   +0x004 Handler : 0x772eaf30     _EXCEPTION_DISPOSITION  ntdll!_except_handler4+0
Using the -r parameter will display the structure recursively, if possible.
1
2
3
4
5
6
7
0:000> dt -r ntdll!_EXCEPTION_REGISTRATION_RECORD 0056f280
   +0x000 Next             : 0x0056f4e4 _EXCEPTION_REGISTRATION_RECORD
   +0x000 Next             : 0x0056f53c _EXCEPTION_REGISTRATION_RECORD
   +0x000 Next             : 0xffffffff _EXCEPTION_REGISTRATION_RECORD
   +0x004 Handler          : 0x772eaf30           _EXCEPTION_DISPOSITION  ntdll!_except_handler4+0
   +0x004 Handler          : 0x772eaf30        _EXCEPTION_DISPOSITION  ntdll!_except_handler4+0
   +0x004 Handler          : 0x772eaf30     _EXCEPTION_DISPOSITION  ntdll!_except_handler4+0
Another thing you can do is check the size of a structure with sizeof. In this case, it is 8 because the structure is made up of only 2 dwords of 4 bytes each.
1
2
0:000> ?? sizeof(ntdll!_EXCEPTION_REGISTRATION_RECORD)
unsigned int 8
Enter
In the previous section, we looked at some ways to display memory. However, we can also input data into memory. Using eb, we can write bytes.
1
2
3
4
0:000> eb esp 41

0:000> db esp L2
0043f464  41 0e                                            A.
To write words or dwords, we would use ew and ed respectively.
1
2
3
4
5
0:000> ed esp 41414141

0:000> dd esp L2
0043f464  41414141 779c69ec
To write a string in ASCII, we can use ea, passing the text in quotes.
1
2
3
4
5
0:000> ea esp "Hello world!"

0:000> da esp
0043f464  "Hello world!"
Similar to the above, we can write in Unicode using eu and display it with du. The only difference is how it’s written, as UTF-16 separates bytes with a 00.
1
2
3
4
5
6
7
8
0:000> eu esp "Hello world!"

0:000> du esp
0043f464  "Hello world!"

0:000> db esp L20
0043f464  48 00 65 00 6c 00 6c 00-6f 00 20 00 77 00 6f 00  H.e.l.l.o. .w.o.
0043f474  72 00 6c 00 64 00 21 00-d1 bf a6 77 e4 f6 43 00  r.l.d.!....w..C.
Search
To search for specific strings or bytes, we use the s command, which requires several parameters, starting with the data type. In this case, since we are searching for a dword, we use -d, followed by the starting address, which is 0. For the ending address, we use L?80000000 to refer to the entire address space of the process. Finally, we specify the pattern to search for, which is 41414141, the same pattern we wrote previously.
1
2
3
4
5
0:000> ed esp 41414141

0:000> s -d 0 L?80000000 41414141
00dff538  41414141 779c69ec 779c6a68 00000000  AAAA.i.whj.w....
Depending on the data to search for, we can use different parameters. For example, to search for ASCII strings, we use -a; for Unicode strings, we use -u; and so on.
1
2
3
4
5
6
0:000> s -a 0 L?80000000 "This program cannot be run in DOS mode"
75ae004e  54 68 69 73 20 70 72 6f-67 72 61 6d 20 63 61 6e  This program can
75de004e  54 68 69 73 20 70 72 6f-67 72 61 6d 20 63 61 6e  This program can
7618004e  54 68 69 73 20 70 72 6f-67 72 61 6d 20 63 61 6e  This program can
779b004e  54 68 69 73 20 70 72 6f-67 72 61 6d 20 63 61 6e  This program can
779c004e  54 68 69 73 20 70 72 6f-67 72 61 6d 20 63 61 6e  This program can
Registers
The r instruction displays information about the current context, including all registers and the instruction that the eip register is pointing to, which is about to be executed.
1
2
3
4
5
6
0:000> r
eax=00000000 ebx=00000000 ecx=f5b70000 edx=00000000 esi=779c6a68 edi=779c69ec
eip=77a71a92 esp=00dff538 ebp=00dff564 iopl=0         nv up ei pl zr na pe nc
cs=0023  ss=002b  ds=002b  es=002b  fs=0053  gs=002b             efl=00000246
ntdll!LdrpDoDebuggerBreak+0x2b:
77a71a92 cc              int     3
We can query the value of a specific register like ecx or, if needed, the value of a flag such as zf, which currently is set to 1.
1
2
3
4
5
0:000> r ecx
ecx=f5b70000

0:000> r zf
zf=1
In addition to querying the value of a register, you can also modify it using =. In the following example, we change the value of the ecx register to 41414141.
1
2
3
4
0:000> r ecx=41414141

0:000> r ecx
ecx=41414141
Step
The debugger allows us to execute assembly instructions and analyze their behavior. To execute an instruction, we can use the p command and move to the next one.
1
2
3
4
5
6
0:000> p
eax=00000000 ebx=00000000 ecx=be8e0000 edx=00000000 esi=779c6a68 edi=779c69ec
eip=77a71a93 esp=0070fa08 ebp=0070fa34 iopl=0         nv up ei pl zr na pe nc
cs=0023  ss=002b  ds=002b  es=002b  fs=0053  gs=002b             efl=00000244
ntdll!LdrpDoDebuggerBreak+0x2c:
77a71a93 eb07            jmp     ntdll!LdrpDoDebuggerBreak+0x35 (77a71a9c)
Similar to the p command, the t command advances through instructions. However, the difference is that t steps into a function call, whereas p only executes the function call without entering it.
1
2
3
4
5
6
0:000> t
eax=00000000 ebx=00000000 ecx=75ef0000 edx=00000000 esi=779c6a68 edi=779c69ec
eip=77a71a93 esp=005bf4d4 ebp=005bf500 iopl=0         nv up ei pl zr na pe nc
cs=0023  ss=002b  ds=002b  es=002b  fs=0053  gs=002b             efl=00000244
ntdll!LdrpDoDebuggerBreak+0x2c:
77a71a93 eb07            jmp     ntdll!LdrpDoDebuggerBreak+0x35 (77a71a9c)
If we don’t want to step through instructions one by one, we can use pt to advance to the next ret instruction or pc to advance to the next call instruction.
1
2
3
4
5
6
7
8
9
10
11
12
13
0:000> pt
eax=00000000 ebx=00000000 ecx=912e89a0 edx=00000000 esi=779c6a68 edi=779c69ec
eip=77a71ab2 esp=0070fa38 ebp=0070fc98 iopl=0         nv up ei pl zr na pe nc
cs=0023  ss=002b  ds=002b  es=002b  fs=0053  gs=002b             efl=00000246
ntdll!LdrpDoDebuggerBreak+0x4b:
77a71ab2 c3              ret

0:000> pc
eax=00000000 ebx=00000000 ecx=912e89a0 edx=00000000 esi=779c6a68 edi=779c69ec
eip=77a6bfe2 esp=0070fa3c ebp=0070fc98 iopl=0         nv up ei pl zr na pe nc
cs=0023  ss=002b  ds=002b  es=002b  fs=0053  gs=002b             efl=00000246
ntdll!LdrpInitializeProcess+0x1c40:
77a6bfe2 e802bcfbff      call    ntdll!LdrpDropLastInProgressCount (77a27be9)
Breakpoints
An important feature is breakpoints, which allow us to stop at a specific point, such as a function call. For this, we use the bp command, where we can specify an address, and when the program reaches it, it will stop. Using bl, we can view all currently existing breakpoints along with their IDs.
1
2
3
4
0:000> bp kernel32!WriteFile

0:000> bl
     0 e Disable Clear  75e03850     0001 (0001)  0:**** KERNEL32!WriteFile
Using bd, we can disable a breakpoint, and with the be command, we can enable it.
1
2
3
4
5
6
7
8
9
10
0:000> bd 0

0:000> bl
     0 d Enable Clear  75e03850     0001 (0001)  0:**** KERNEL32!WriteFile

0:000> be 0

0:000> bl
     0 e Disable Clear  75e03850     0001 (0001)  0:**** KERNEL32!WriteFile
With bc, we can delete a breakpoint by specifying its ID, or use * to delete all breakpoints.
1
2
3
0:000> bc 0

0:000> bl
When we set a breakpoint and run the program, it will halt when it reaches that point. In this case, WriteFile is called when we save a file from notepad.exe, which we are debugging, and the program will stop at that breakpoint.
1
2
3
4
5
6
7
8
9
0:000> bp kernel32!WriteFile

0:000> g
Breakpoint 0 hit
eax=0050ed48 ebx=00000000 ecx=00000007 edx=00000000 esi=00000007 edi=009a37e8
eip=75e03850 esp=0050ed28 ebp=0050ed5c iopl=0         nv up ei pl nz na po nc
cs=0023  ss=002b  ds=002b  es=002b  fs=0053  gs=002b             efl=00200202
KERNEL32!WriteFile:
75e03850 ff255c10e675    jmp     dword ptr [KERNEL32!_imp__WriteFile (75e6105c)] ds:002b:75e6105c={KERNELBASE!WriteFile (76299530)}
According to the documentation, this function consists of 5 arguments which are represented in the debugger as 5 dwords. We can display them using dds. For example, lpNumberOfBytesWritten at esp + 0xc indicates the number of bytes to be written (7).
1
2
3
4
5
6
7
BOOL WriteFile(
  [in]                HANDLE       hFile,
  [in]                LPCVOID      lpBuffer,
  [in]                DWORD        nNumberOfBytesToWrite,
  [out, optional]     LPDWORD      lpNumberOfBytesWritten,
  [in, out, optional] LPOVERLAPPED lpOverlapped
);
1
2
3
4
5
6
0:000> dds esp L5
0050ed28  00fbfe40 notepad!AnsiWriteFile+0xa0
0050ed2c  00000488
0050ed30  009a37e8
0050ed34  00000007
0050ed38  0050ed48
We can set a breakpoint so that when it hits, it displays the number of bytes to be written using .printf. We know that this quantity is at esp + 0xc, so when we write a file from notepad.exe, the debugger will show the number of bytes being written to the file.
1
2
3
4
5
6
7
8
9
0:000> bc *

0:000> bp kernel32!WriteFile ".printf \"Number Of Bytes Written: %d\", poi(esp + 0xc); .echo; g"

0:000> g
Number Of Bytes Written: 5
Number Of Bytes Written: 7
Number Of Bytes Written: 13
Modules
Using the lm command, we can see all the modules that have been loaded for this program. With lm m, we can search for modules with a specific pattern.
1
2
3
4
5
6
7
8
9
10
11
12
13
14
15
16
17
18
19
20
21
22
23
0:000> lm
start    end        module name
00fb0000 00fde000   notepad    (pdb symbols)          c:\symbols\notepad.pdb\21C3A2873E9F57AD16E58CEB784EEFDC1\notepad.pdb
73150000 73360000   COMCTL32   (deferred)
75860000 75ae0000   combase    (deferred)
75ae0000 75b9f000   msvcrt     (deferred)
75de0000 75ed0000   KERNEL32   (pdb symbols)          c:\symbols\wkernel32.pdb\C326144F3CCFAE9FC9E07C0C1F71E8631\wkernel32.pdb
75ed0000 75ff0000   ucrtbase   (deferred)
76180000 763ba000   KERNELBASE   (deferred)
763f0000 764af000   RPCRT4     (deferred)
765a0000 7661b000   msvcp_win   (deferred)
76620000 767bc000   USER32     (deferred)
77060000 77078000   win32u     (deferred)
77080000 77107000   shcore     (deferred)
77210000 772f8000   gdi32full   (deferred)
777e0000 77804000   GDI32      (deferred)
779c0000 77b64000   ntdll      (pdb symbols)          c:\symbols\wntdll.pdb\AE4A9CEFBA27BD00DEBC6271B9E3E4BE1\wntdll.pdb

0:000> lm m kernel*
Browse full module list
start    end        module name
75120000 75210000   KERNEL32   (pdb symbols)          c:\symbols\wkernel32.pdb\C326144F3CCFAE9FC9E07C0C1F71E8631\wkernel32.pdb
76d30000 76f6a000   KERNELBASE   (deferred)
The x command allows us to examine the symbols of a module using a pattern.
1
2
3
4
0:000> x kernel32!WriteFile*
75e03860          KERNEL32!WriteFileEx (_WriteFileEx@20)
75e03870          KERNEL32!WriteFileGather (_WriteFileGather@20)
75e03850          KERNEL32!WriteFile (_WriteFile@20)
Another interesting command is !dh, which will show us more detailed information about a module, such as the base address, its sections, permissions, offsets, and more.
1
2
3
4
5
6
7
8
9
10
11
12
13
14
15
16
17
18
19
20
21
22
23
24
25
26
27
28
29
30
31
32
33
34
35
36
37
38
39
40
41
42
43
44
45
46
47
48
49
50
51
52
53
54
55
56
57
58
59
60
61
62
63
64
65
66
67
68
69
70
71
72
73
74
75
76
77
78
79
80
81
82
83
84
85
86
87
88
89
90
91
92
93
94
95
96
97
98
99
100
101
102
103
104
105
0:000> !dh kernel32

File Type: DLL
FILE HEADER VALUES
     14C machine (i386)
       6 number of sections
F56028CF time date stamp
       0 file pointer to symbol table
       0 number of symbols
      E0 size of optional header
    2102 characteristics
            Executable
            32 bit word machine
            DLL

OPTIONAL HEADER VALUES
     10B magic #
   14.20 linker version
   65000 size of code
   33000 size of initialized data
       0 size of uninitialized data
   1F8E0 address of entry point
   10000 base of code
         ----- new -----
75120000 image base
   10000 section alignment
    1000 file alignment
       3 subsystem (Windows CUI)
   10.00 operating system version
   10.00 image version
   10.00 subsystem version
   F0000 size of image
    1000 size of headers
   A1F9A checksum
00040000 size of stack reserve
00001000 size of stack commit
00100000 size of heap reserve
00001000 size of heap commit
    4140  DLL characteristics
            Dynamic base
            NX compatible
            Guard
   92CA0 [    DC60] address [size] of Export Directory
   A0900 [     780] address [size] of Import Directory
   D0000 [     520] address [size] of Resource Directory
       0 [       0] address [size] of Exception Directory
   99000 [    3BD0] address [size] of Security Directory
   E0000 [    482C] address [size] of Base Relocation Directory
   854D0 [      70] address [size] of Debug Directory
       0 [       0] address [size] of Description Directory
       0 [       0] address [size] of Special Directory
       0 [       0] address [size] of Thread Storage Directory
   80138 [      AC] address [size] of Load Configuration Directory
       0 [       0] address [size] of Bound Import Directory
   80B50 [    14E8] address [size] of Import Address Table Directory
   92ACC [      60] address [size] of Delay Import Directory
       0 [       0] address [size] of COR20 Header Directory
       0 [       0] address [size] of Reserved Directory


SECTION HEADER #1
   .text name
   64172 virtual size
   10000 virtual address
   65000 size of raw data
    1000 file pointer to raw data
       0 file pointer to relocation table
       0 file pointer to line numbers
       0 number of relocations
       0 number of line numbers
60000020 flags
         Code
         (no align specified)
         Execute Read

SECTION HEADER #2
  .rdata name
   2A078 virtual size
   80000 virtual address
   2B000 size of raw data
   66000 file pointer to raw data
       0 file pointer to relocation table
       0 file pointer to line numbers
       0 number of relocations
       0 number of line numbers
40000040 flags
         Initialized Data
         (no align specified)
         Read Only

SECTION HEADER #3
   .data name
     C78 virtual size
   B0000 virtual address
    1000 size of raw data
   91000 file pointer to raw data
       0 file pointer to relocation table
       0 file pointer to line numbers
       0 number of relocations
       0 number of line numbers
C0000040 flags
         Initialized Data
         (no align specified)
         Read Write
......................................................................
Calculator
A function of WinDbg is the ability to perform calculations. This is done using the expression ?. In the following example, you can see how to calculate the size of kernel32 from its base address and end address. The result is displayed in both hex and decimal formats.
1
2
3
4
5
6
7
0:000> lm m kernel32
Browse full module list
start    end        module name
75120000 75210000   KERNEL32   (pdb symbols)

0:000> ? 75ed0000 - 75de0000
Evaluate expression: 983040 = 000f0000
By default, ? assumes that the value it receives is in hexadecimal. However, you can use a prefix to specify the format: 0x for hexadecimal, 0n for decimal, or 0y for binary.
1
2
3
4
5
6
7
8
9
10
11
12
0:000> ? 41414141
Evaluate expression: 1094795585 = 41414141

0:000> ? 0x41414141
Evaluate expression: 1094795585 = 41414141

0:000> ? 0n1094795585
Evaluate expression: 1094795585 = 41414141

0:000> ? 0y01000001010000010100000101000001
Evaluate expression: 1094795585 = 41414141
Using .formats, we can view the value in all its possible representations, including hexadecimal, decimal, binary, octal, ASCII, and some other variants.
1
2
3
4
5
6
7
8
9
10
11
12
0:000> .formats 41414141
Evaluate expression:
  Hex:     41414141
  Decimal: 1094795585
  Decimal (unsigned) : 1094795585
  Octal:   10120240501
  Binary:  01000001 01000001 01000001 01000001
  Chars:   AAAA
  Time:    Thu Sep  9 23:53:05 2004
  Float:   low 12.0784 high 0
  Double:  5.40901e-315
Others
The command !teb allows us to view the information of the TEB (Thread Environment Block) structure for the current thread. This contains information such as stack addresses and exception handling.
1
2
3
4
5
6
7
8
9
10
11
12
13
14
15
16
17
18
0:000> !teb
TEB at 00469000
    ExceptionList:        006af9f0
    StackBase:            006b0000
    StackLimit:           0069f000
    SubSystemTib:         00000000
    FiberData:            00001e00
    ArbitraryUserPointer: 00000000
    Self:                 00469000
    EnvironmentPointer:   00000000
    ClientId:             000005e0 . 00000700
    RpcHandle:            00000000
    Tls Storage:          02933180
    PEB Address:          00466000
    LastErrorValue:       0
    LastStatusValue:      0
    Count Owned Locks:    0
    HardErrorMode:        0
Using !exchain, we can list the SEH (Structured Exception Handling) chain structure, which is responsible for handling exceptions. This way, we can see which exception handler will be triggered when an exception occurs.
1
2
3
4
5
6
7
8
9
10
0:000> !exchain
006af9f0: ntdll!_except_handler4+0 (772eaf30)
  CRT scope  0, filter: ntdll!LdrpDoDebuggerBreak+2e (77321a95)
                func:   ntdll!LdrpDoDebuggerBreak+32 (77321a99)
006afc54: ntdll!_except_handler4+0 (772eaf30)
  CRT scope  0, func:   ntdll!LdrpInitializeProcess+1e57 (7731c1f9)
006afcac: ntdll!_except_handler4+0 (772eaf30)
  CRT scope  0, filter: ntdll!_LdrpInitialize+3d9f8 (77313f3f)
                func:   ntdll!_LdrpInitialize+3da0b (77313f52)
Invalid exception stack at ffffffff
To view the protections of a memory address, we can use !vprot. For example, the stack currently has permissions of 0x4, which translates to READWRITE.
1
2
3
4
5
6
7
8
0:000> !vprot esp
BaseAddress:       006af000
AllocationBase:    00670000
AllocationProtect: 00000004  PAGE_READWRITE
RegionSize:        00001000
State:             00001000  MEM_COMMIT
Protect:           00000004  PAGE_READWRITE
Type:              00020000  MEM_PRIVATE
Although there are many more commands for WinDbg, the ones presented above are some of the most common or functional when it comes to exploitation. However, you can always learn more by reading documentation and experimenting with the debugger.